
Recently on a project, I encountered a frustrated individual stating that they wished they could step through the T-SQL code like you can with other scripting languages. I indicated that it was possible in T-SQL using breakpoints.
Breakpoints
Breakpoints specify that the T-SQL debugger pause execution on a specific T-SQL statement, where then you can review the state of the code elements at that point. When running the T-SQL debugger, you can toggle a breakpoint on specific statements. When execution reaches a statement with a breakpoint, the debugger pauses execution so you can view debugging information, such as the values of variables and parameters.
You can manage breakpoints individually in the editor window, or collectively by using the Breakpoints window. You can edit breakpoints to specify items such as specific conditions under which execution should pause, or the actions to be taken if the breakpoint is executed.
You can also debug SQL Server stored procedures, user-defined functions (UDFs), and triggers using breakpoints in SQL Server Management Studio (SSMS) very similarly as you can debug other types of scripts.
Breakpoint Tasks
Toggle a Breakpoint
In SSMS, you can set a breakpoint very easily which will then permit the ‘stepping through’ of the T-SQL script one line at a time. This is also referred to as ‘Toggling a Breakpoint’. When you toggle a breakpoint you are specifying the T-SQL statement on which you want the debugger to pause.

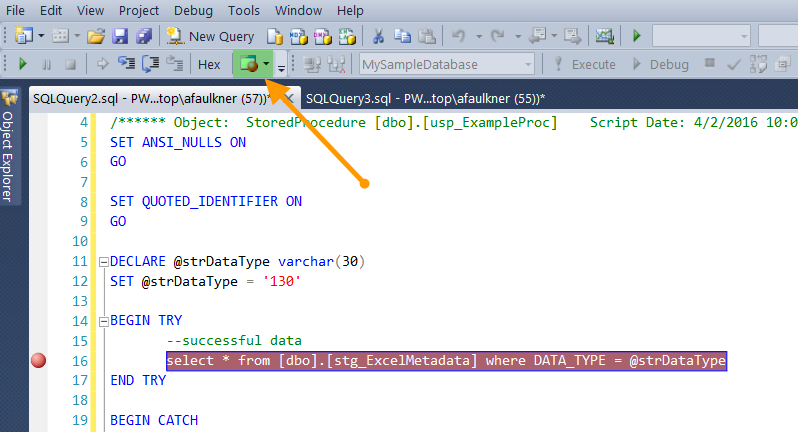
Once the breakpoint has been set, it appears as a circle icon in the grey bar to the left of the T-SQL statement. To add a breakpoint to a T-SQL statement in SSMS, simply click on the grey bar.
T-SQL breakpoints are applied to the entire T-SQL statement on that line. When a breakpoint is toggled on, the debugger highlights the associated T-SQL statement.
Disable, Enable, and Delete Breakpoints
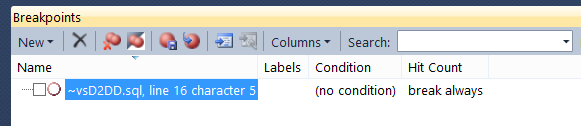
Breakpoints Window
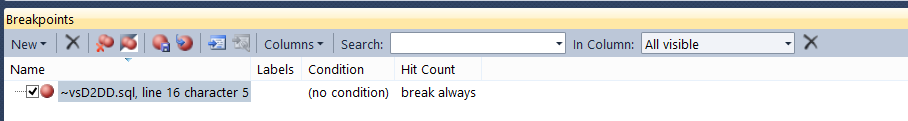
To view and manage all the open breakpoints, you can use the Breakpoints window. Use the Breakpoints window to view breakpoint information and to take actions such as deleting, disabling, or enabling breakpoints.
Disabling a breakpoint prevents it from pausing execution, but leaves the definition in place in case you want to enable the breakpoint later. Deleting a breakpoint removes it permanently. You must toggle a new breakpoint to pause execution on the statement.
There are several ways to open the Breakpoints window.
On the Debug menu, click Windows, and then click Breakpoints.
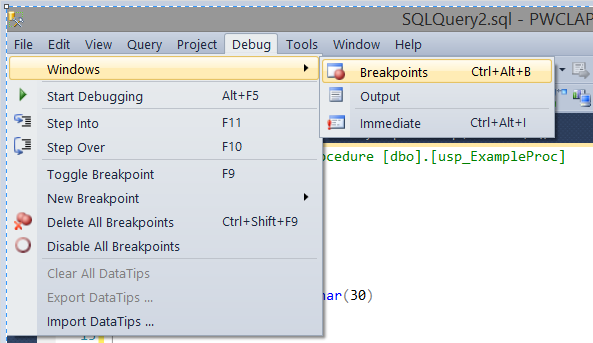
On the Debug toolbar, click the Breakpoints button. You can also open the Breakpoints window by pressing CTRL+ALT+B keys.
Disabling Breakpoints
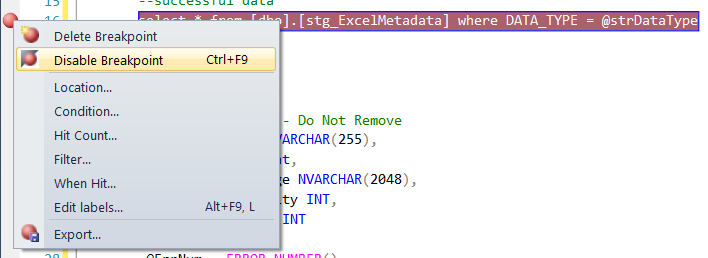
To disable a single breakpoint you can use the SSMS Query Editor window or use the Breakpoints window.
In the Query Editor window, right-click the breakpoint, and then click Disable Breakpoint.
In the Breakpoints window, clear the check box to the left of the breakpoint.
To disable all breakpoints you can use the Debug Menu or use the Breakpoints window.
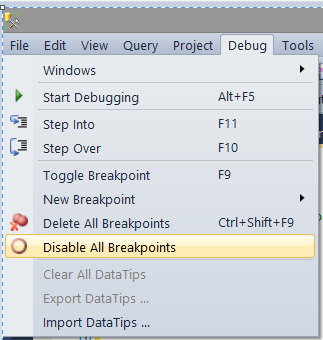
On the Debug menu, click Disable All Breakpoints.
On the toolbar of the Breakpoints window, click the Disable All Breakpoints button.

Enabling & Deleting Breakpoints
For enabling and deleting breakpoints you can use the SSMS Query Editor window or use the Breakpoints window. The same techniques used for disabling breakpoints are also available for enabling and deleting them.
Step Through T-SQL Code
As previously mentioned, the T-SQL debugger enables you to control which T-SQL statements are run in a Database Engine Query Editor window. You can pause the debugger on individual statements and then view the state of the code elements at that point.
Step into the next statement
In this example, we will step into a series of T-SQL statements using a single breakpoint. To initiate the T-SQL Debugger, press the F11 key.
The results of each step are presented below:
- Press the F11 key

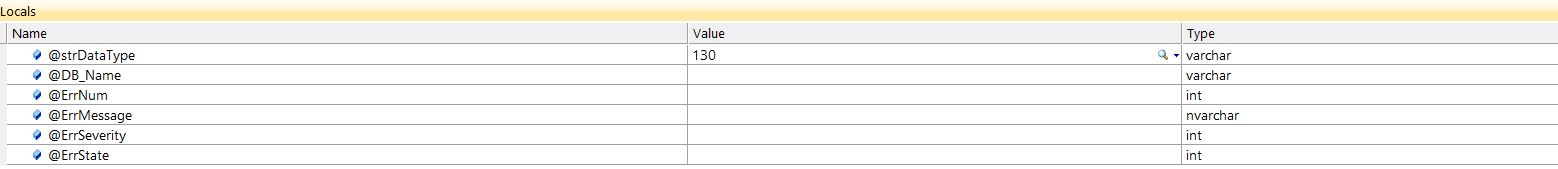
- Press the F11 key until I reach the variable declaration. In the locals window, it provides names of the variables in the script, the value assigned, and the data type of the variable.
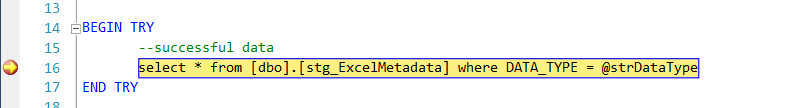
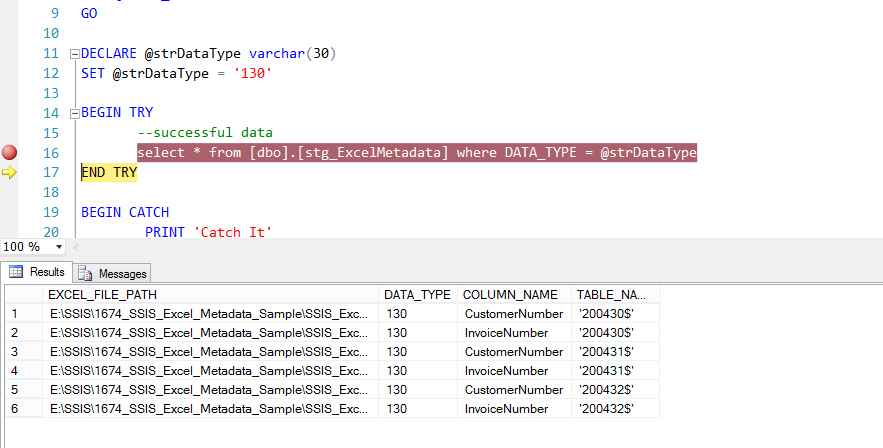
- Press F11 again, this reaches the T-SQL statement in the TRY portion of the TRY-CATCH block.
- Press F11 again, this executes the T-SQL statement and provides the query results in the Results window.
- Press F11 one last time to end the debug session and close the T-SQL debugger.
See the Video Blog for Breakpoints with T-SQL
Leave a Reply